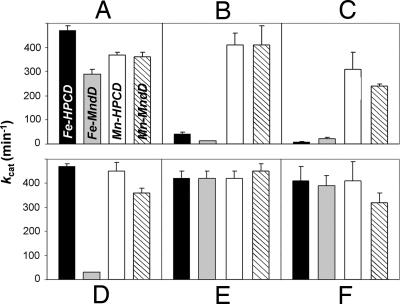
Fig. 2.
Activation and inhibition of HPCD and MndD activity in 50 mM MOPS buffer (pH 7.8). The average enzyme activity is displayed as one bar within each panel, where each enzyme is denoted as follows: Fe-HPCD, black bars; Fe-MndD, gray bars; Mn-HPCD, open bars; Mn-MndD, hatched bars. (A) Activities of as-isolated enzymes. (B and C) Data collected after the enzymes were treated with 1 mM H2O2 and potassium ferricyanide, respectively. (D) Activities of the as-isolated enzymes after a 1-h exposure to air. (E and F) Activity studies where the air-exposed enzymes were treated with 1 mM sodium ascorbate and potassium ferrocyanide, respectively.

