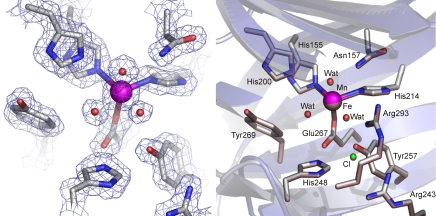
Fig. 3.
Structure of the active-site region for Mn-HPCD at 1.7-Å resolution (Protein Data Bank entry 3BZA). (Left) The blue 2Fobs − Fcalc electron-density map is contoured at 1.4 σ. Atom colors: gray, carbon: blue, nitrogen; red, oxygen; magenta, manganese. (Right) Structure superposition of the metal centers in Fe-HPCD (Protein Data Bank entry 2IG9; bronze) and Mn-HPCD (Protein Data Bank entry 3BZA; colors as in Left). The blue and gray cartoon depicts the secondary structure elements for Fe-HPCD and Mn-HPCD, respectively.

