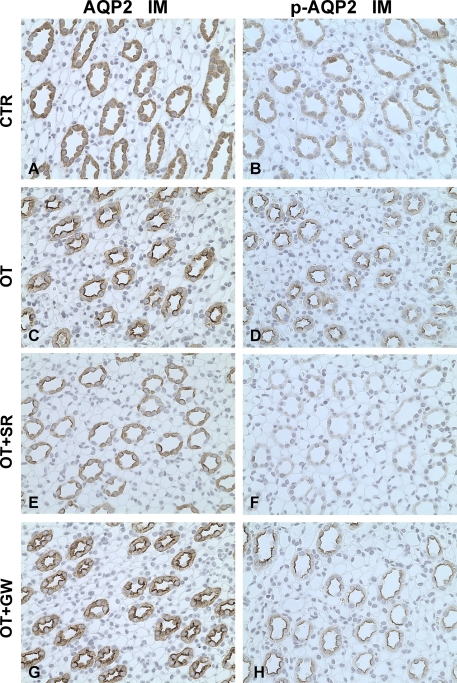
Figure 6.
Immunoperoxidase microscopy of AQP2 (A, C, E, G) and p-AQP2 (B, D, F, H) in the inner medulla in rats from protocol 2. In CTR Brattleboro rats, AQP2 (A) and p-AQP2 (B) labeling was seen at the apical plasma membrane domains and intracellular cytoplasmic vesicles of IMCD. In the IMCD of OT rats, the apical AQP2 (C) and p-AQP2 (D) labeling intensity was much stronger compared with that seen in kidneys from control rats. Compared with OT rats and CTR rats, the labeling of AQP2 (E) and p-AQP2 (F) in the IMCD of OT+SR rats was much weaker at the apical plasma membrane domains and intracellular cytoplasmic vesicles of IMCD. In OT+GW rats, the increased apical AQP2 (G) and p-AQP2 (H) labeling intensity did not differ from that seen in kidneys from OT rats (C and D). Magnification: ×400.

