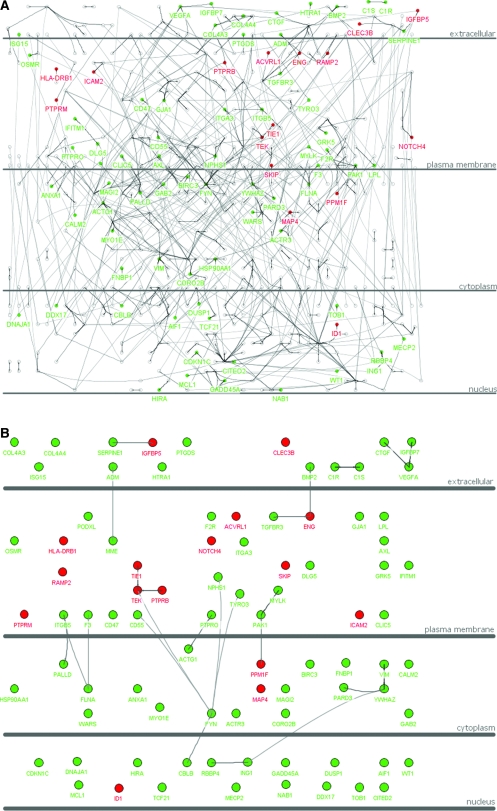
Figure 3.
(A) Gene expression pattern of DN-regulated genes over GlomNet. Red color indicates that the gene was upregulated in the DN glomeruli, and green color indicates that the gene was downregulated. (B) Illustration of DN-regulated genes over GlomNet. This is simplified from A, only showing the DN-regulated genes over GlomNet.

