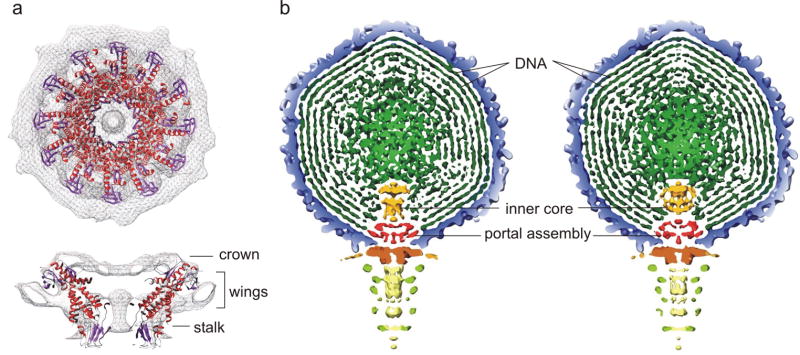
Figure 5.
The interior of bacteriophage N4. (a) The N4 portal assembly showing the crown, wing and the stalk domains. The atomic structure of the ϕ29 connector protein (Protein Data Bank accession number 1H5W) was fitted into the 5-fold-averaged cryoEM density of the N4 portal assembly. The α-helices and β-strands of the ϕ29 connector are shown in red and purple, respectively. (b) Comparison of wild-type and gp50-minus viruses. Cross section of the 5-fold-averaged wild-type (left) and gp50-minus (right) viruses viewed perpendicular to the long axis of the phage. The densities are displayed at 2.5σ above their respective means to show the molecular boundaries of portal and inner core proteins. The dsDNA, inner core proteins, and portal assembly are colored in dark green, orange, and red, respectively. All the other components of the phage are colored as in Figure 3.

