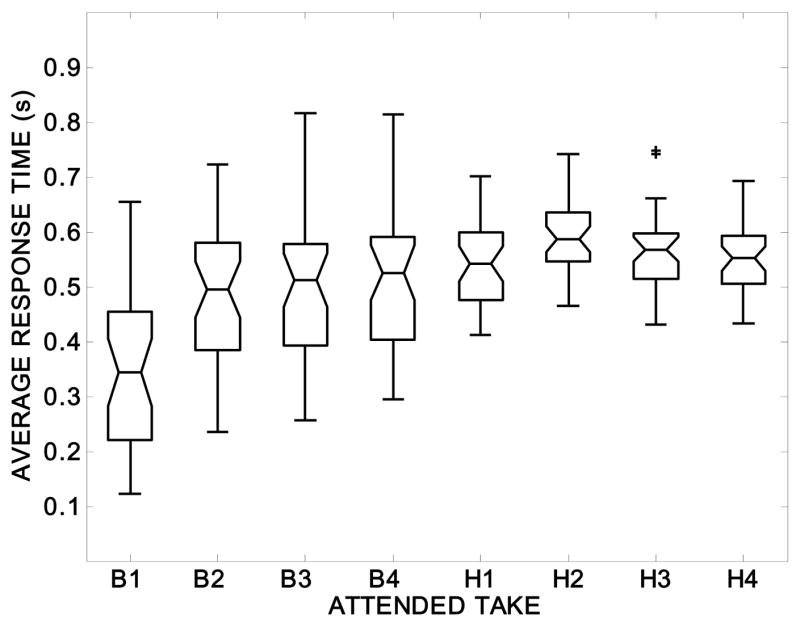
Figure 7.

Average response times to attended events varied across different takes of the attended ball game (B1–4) and hand game (H1–4) scenes. Blocked views during the ball game resulted in wider variations in response time. The boxes enclose the 25th and 75th percentile values, with the median shown at the “waist”. The “whiskers” enclose the maximum and minimum values, but H3 excludes two outliers (+) more than 1.5 times the interquartile range above the 75th percentile.
