
Figure 5.
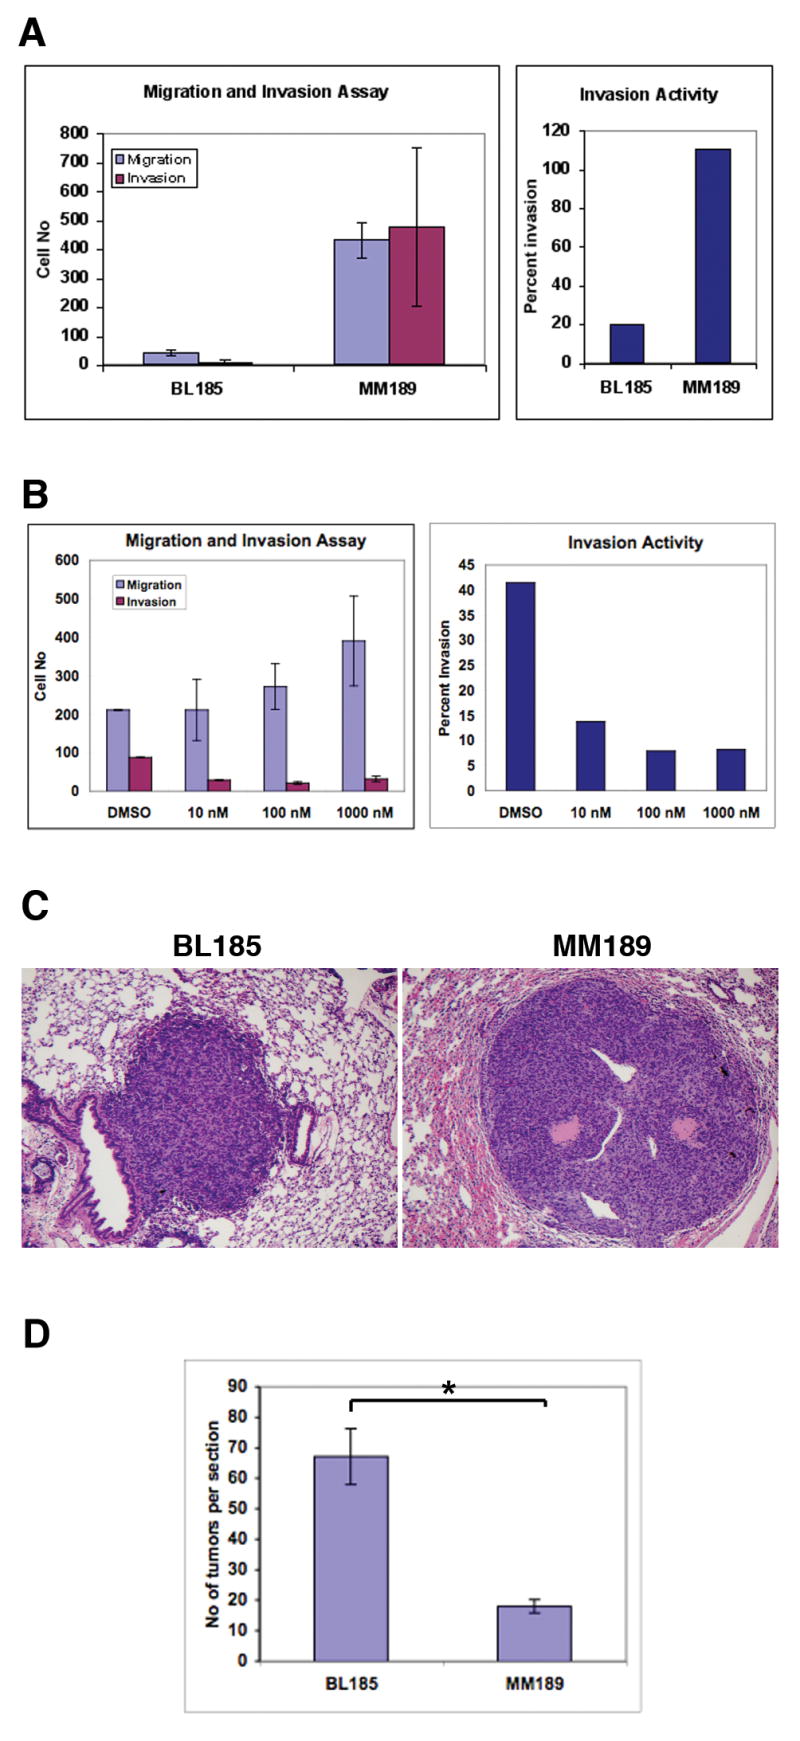
(A) Measurement of the migration (blue) and invasion (red) capabilities of the BL185 and MM189 cell lines (left panel). Error is standard deviation from the mean. The number of invading cells is plotted as a percentage of the number of migrating cells (right panel). (B) Migration and invasion activity of MM189 cells in response to increasing concentrations of the mTOR antagonist rapamycin (left panel). Error is standard deviation from the mean. The number of invading cells is plotted as a percentage of the number of migrating cells (right panel). (C) H&E stained images of lung lesions induced after tail vein injection of the BL185 (left panel) and MM189 (right panel) cell lines. (D) Quantification of lung colony formation in the tail vein injection assay. * p<0.001. Error bars are standard error of the mean.