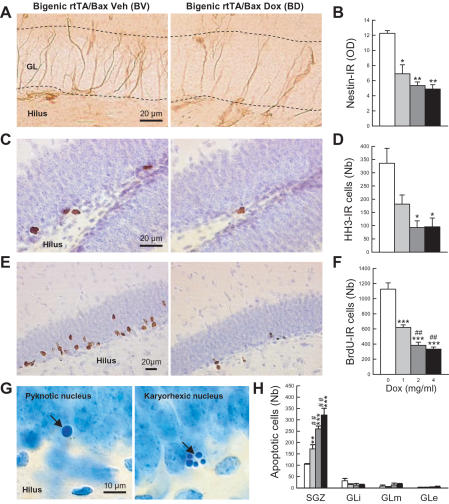
Figure 2. Effects of short-term Dox treatment on adult hippocampal neurogenesis.
(A) Illustration of nestin staining. (B) Densitometric analysis of nestin-IR. (C) Illustration of dividing cells visualized by HH3 staining. (D) Number of HH3-IR cells. (E) Illustrations of newborn cells visualized by BrdU staining. (F) Number of BrdU-IR cells. (G) Illustrations of apoptotic cells. (H) Number of apoptotic cells in the subgranular zone where newborn cells are produced (SGZ) and in the internal (GLi), medial (GLm) and external (GLe) granular cell layer. GL = granular cell layer. *: p≤0.05, **: p≤0.01, ***: p≤0.001 in comparison to the bigenic-vehicle group. ##: p≤0.01, in comparison to bigenic fed with Dox at 1 mg/ml.

