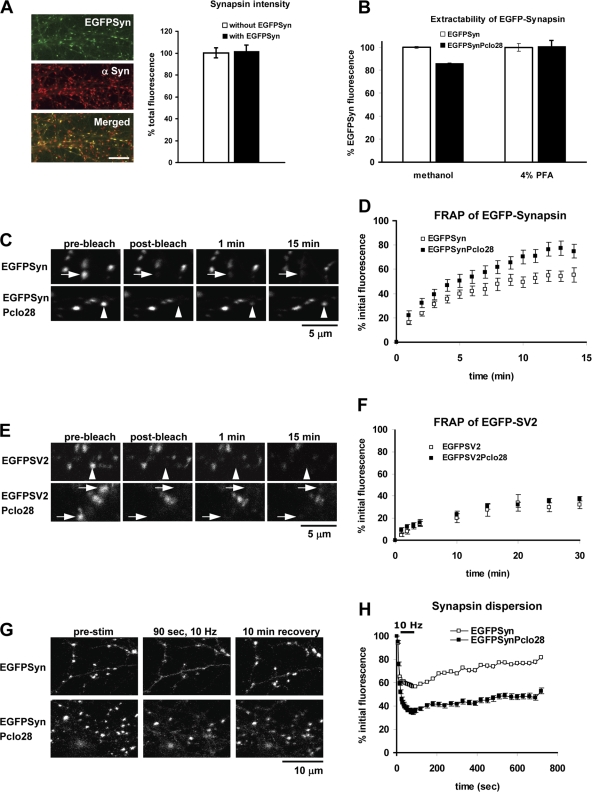
Figure 5.
Steady-state and activity-dependent dynamics of EGFP-Synapsin1a are altered at synapses lacking Piccolo. (A, left) Images of neurons infected with EGFP-Synapsin1a (green) and immunostained with Synapsin1a antibodies (red). (A, right) Bar graph comparing the intensity of Synapsin immunoreactivity at boutons with or without EGFP-Synapsin1a. Total Synapsin levels are similar for infected and uninfected neurons. n > 100 puncta per condition. Bar, 10 μm. (B) EGFP-Synapsin1a fluorescence intensity at presynaptic boutons with (EGFPSyn) or without (EGFPSynPclo28) Piccolo after methanol versus 4% paraformaldehyde fixation (n > 800 puncta, seven fields of view per condition). (C) Time-lapse images of EGFP-Synapsin1a puncta. Single fluorescent puncta (indicated by arrows) were photobleached and their recovery was monitored over time. (D) Fluorescence recovery curves for EGFP-Synapsin1a puncta at boutons with (EGFPSyn, n = 20) or without (EGFPSynPclo28, n = 17) Piccolo. (E) Images of EGFP-SV2 puncta at boutons with (EGFPSV2) or without (EGFPSV2Pclo28) Piccolo, photobleached as in C. Arrowheads indicate the positions of EGFP puncta that are bleached during FRAP experiments. (F) Fluorescence recovery curves for EGFP-SV2 puncta at synapses with (EGFPSV2, n = 8) or without (EGFP-SV2Pclo28, n = 12) Piccolo. (G) Time-lapse images of EGFP-Synapsin1a puncta. Images were acquired before, during, and after Synapsin dispersion was elicited with 10-Hz, 90-s stimulation. Shown here are sample images taken before and immediately after stimulation (10 Hz for 90 s) as well as after 10 min of recovery. (H) Graphical representation of data from G plotting the mean change in fluorescence intensity over time at boutons with or without Piccolo (n > 100 puncta per condition). The bar in the top left indicates time during which stimulation (10 Hz) was applied. Error bars indicate SEM.

