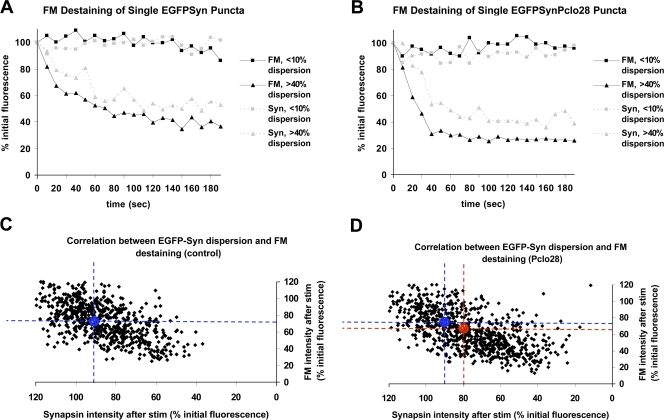
Figure 6.
Synapsin1a dispersion and FM destaining are tightly correlated. (A and B) FM5-95 destaining curves for individual EGFP-Synapsin1a puncta at boutons with (A) or without (B) Piccolo. Shown in black are examples of FM destaining curves for which there was either dramatic (>40%; triangles) or minimal (<10%; squares) dispersion of Synapsin. Shown in light gray are EGFP-Synapsin intensities for these boutons. (C and D) Correlation analysis of EGFP-Synapsin1a dispersion and FM5-95 destaining at synapses with (C) or without (D) Piccolo. Plotted are EGFP-Synapsin1a and FM intensity values (expressed as a percentage initial fluorescence) at the final time point (t =180 s) of 5-Hz stimulation (control = 709 puncta; Pclo28 = 855 puncta). Dashed lines and circles indicate mean intensity values for Synapsin and FM at control boutons (blue; 90.8 ± 1.0% and 75.6 ± 0.9%, respectively) and those lacking Piccolo (red; 79.2 ± 0.9% and 65.5 ± 0.8%, respectively). Note that values for boutons lacking Piccolo are significantly shifted toward the bottom right.

