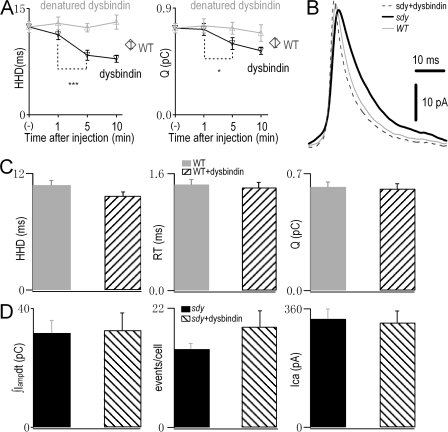
Figure 2.
Microdialysis of purified dysbindin protein rescues the slow kinetics and reduced Q but not the probability and total amount of release in sdy mice. (A) Time course of the effects of intracellular dysbindin (black line) or heat-denatured dysbindin (gray line) on the kinetics of amperometric spikes and Q in sdy chromaffin cells. After establishing whole-cell mode, amperometric spikes were elicited every 5 min by a 2-s depolarization from −70 to 0 mV. The first points (−) represent data before dysbindin dialysis in sdy cells. The second, third, and fourth data points correspond to 1, 5, and 10 min after establishing whole-cell recording with 0.2 μg/μl full-length dysbindin or the denatured protein in the patch pipette. Note the appearance of fast kinetics of amperometric spikes at 5 min after dysbindin dialysis and the lack of difference between 5 and 10 min. In WT control, diamond data points indicate the mean values of amperometric spikes obtained at 5 and 10 min without dysbindin treatment. n = 201 spikes (−; 13 cells, 2 sdy mice), 116 spikes (1 min; 11 cells, 2 sdy mice), 94 spikes (5 min), 81 spikes (10 min), and 193 spikes (14 cells, 2 WT mice). (B) Averaged amperometric spikes obtained at 5 and 10 min after establishing whole-cell recording in untreated WT (gray) or sdy cells without (black) or with dysbindin addition (dotted line). Each line was averaged from 100 amperometric spikes, respectively. (C) In WT cells, histograms show the quantitative analyses of single spike properties (HHD, RT, and Q) without (gray) or with (striped) 5 and 10 min of intracellular dialysis of dysbindin. Data were obtained from the same adrenal slices from two WT littermates. n = 112 spikes (9 cells, WT) and 111 spikes (11 cells, WT + dysbindin). (D) Histograms show the amount of catecholamine secretion (∫Iampdt; left), the number of amperometric events per cell (middle), and calcium currents Ica (right) in sdy cells without (black; 13 cells, 2 sdy mice) or with 5 and 10 min dysbindin dialysis (striped; 11 cells, 2 sdy mice). Error bars indicate the mean ± SEM.

