
Figure 4.
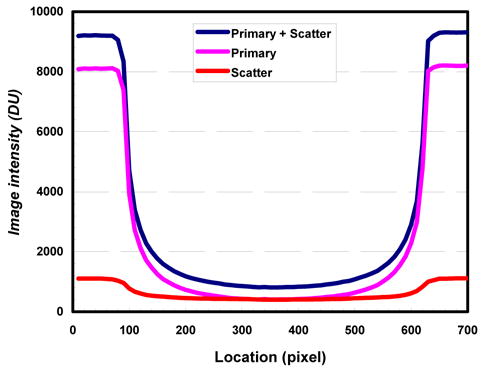
Image intensity plotted across polypropylene phantom. Scatter distribution estimated from a 2-D array of lead beads/bars using SSM technique.
Official websites use .gov
A
.gov website belongs to an official
government organization in the United States.
Secure .gov websites use HTTPS
A lock (
) or https:// means you've safely
connected to the .gov website. Share sensitive
information only on official, secure websites.
Image intensity plotted across polypropylene phantom. Scatter distribution estimated from a 2-D array of lead beads/bars using SSM technique.