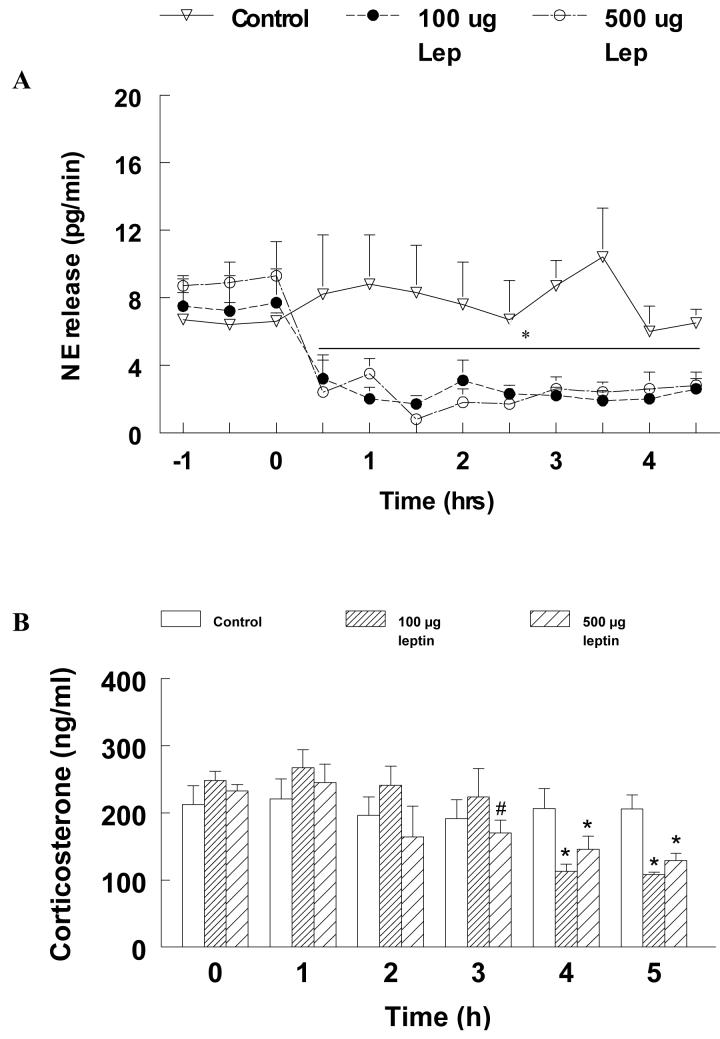
Fig. 2.
A. NE release (pg/min; mean±SE) in control and leptin-treated animals is shown. Leptin or its vehicle was administered at 0 h and perfusate samples from the PVN were collected at 30- min intervals. NE levels in the perfusates were measured using HPLC-EC. * indicates significant difference (p<0.05) compared to pretreatment levels and the control group.
B. Corticosterone (CS; ng/ml; mean±SE) measured at 1 h intervals in control and leptin treated animals. * indicates significant differences compared to pretreatment levels and the control group (p<0.05). # indicates significant difference from the pretreatment levels (p<0.05)

