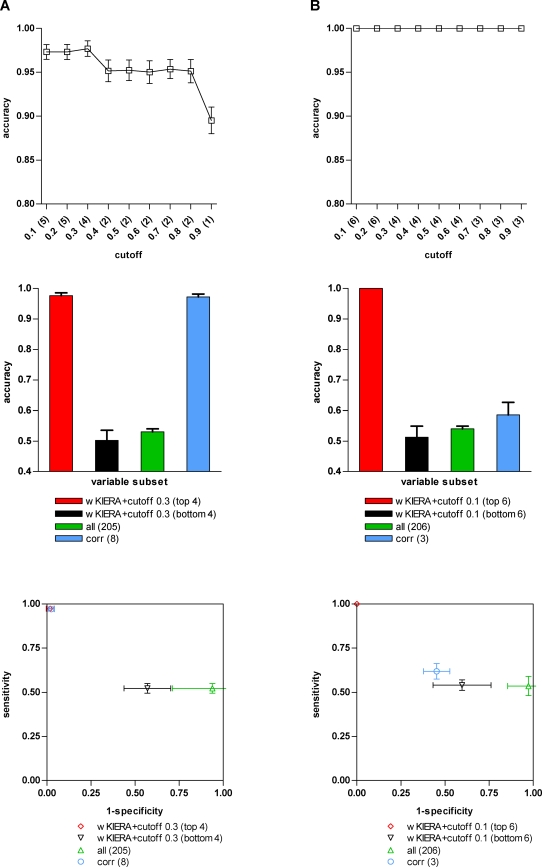
Figure 2. Performance of variable subsets on simulated datasets.
A) LOI dataset (wKIERA settings: poolsize = 10, maxiter = 400, rep = 2000, wkRBF ρ = 0.1); B) NLG dataset (poolsize = 10, maxiter = 400, rep = 2000, wkPoly d = 2). Top: Average SVM accuracy on 100 randomly train/test splits using subsets of variables obtained by thresholding the estimated factors of a weighted kernel with the corresponding cutoff on horizontal axis. Resulting subset size (number of variables) is shown in brackets. Middle: Comparison of classification accuracy of SVM trained using variables selected by best-wKIERA-ranked (red); worst-wKIERA-ranked (black); rank correlation coefficients (blue) and using all variables (green). Results are averaged over 100 randomly training/test splits. Bottom: ROC-space analysis of the SVM classifiers shown in the mid plot.

