Figure 2.

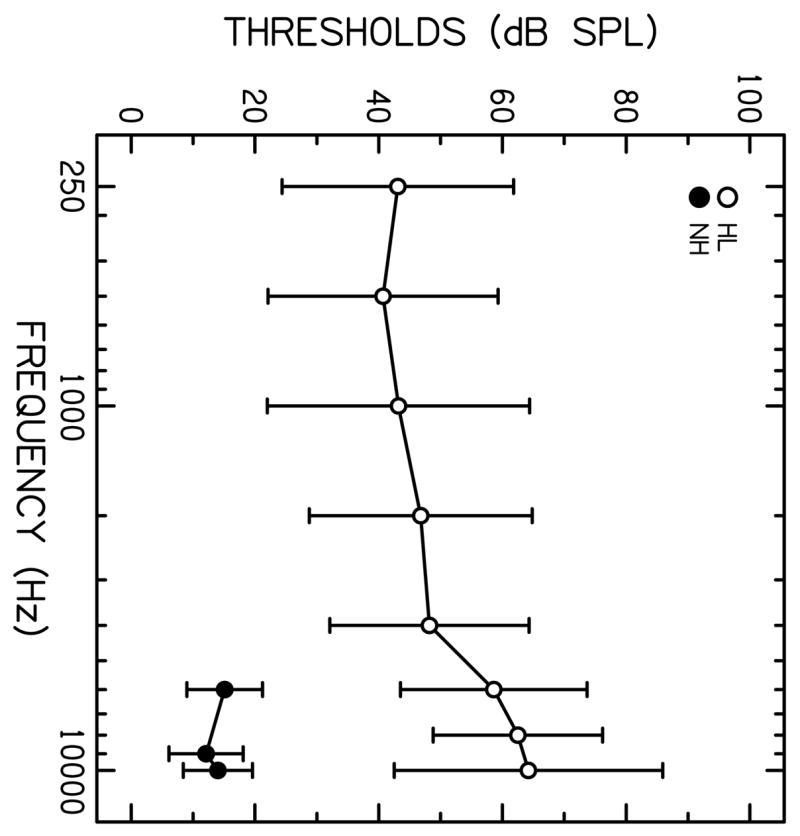
Mean auditory thresholds (in dB SPL) measured with the experimental transducer. Values represent the better ear threshold +/− 1 SD. Only data at 6, 9, and 10 kHz are shown for the group with normal hearing.

Mean auditory thresholds (in dB SPL) measured with the experimental transducer. Values represent the better ear threshold +/− 1 SD. Only data at 6, 9, and 10 kHz are shown for the group with normal hearing.