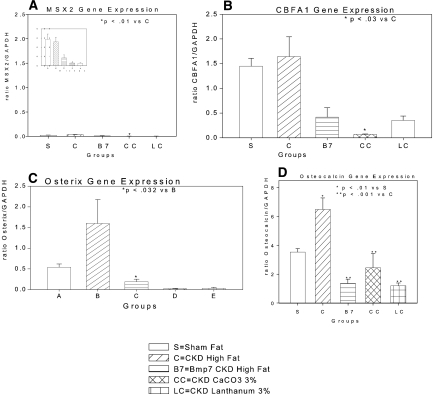
Figure 9.
Gene expression in aortas of various groups of LDLR−/− high fat–fed mice measured by real-time RT-PCR. The various groups of mice were as follows: sham operated (s), CKD vehicle treated (C), CKD BMP-7 treated (B7), CKD 3% CaCO3 treated (CC), and CKD 3% LaCO3 treated (LC). (A) MSX2 expression was low, not induced by CKD, and suppressed with each of the three treatments. Inset shows data for scale of the ratio between 0.0 and 0.5. (B) CBFA1 expression was not stimulated by CKD, but it was inhibited by BMP-7, 3% CaCO3, and 3% LaCO3 treatment. (C) Osterix expression was stimulated by CKD and was inhibited by BMP-7, CaCO3, or LaCO3 treatment. (D) Osteocalcin expression was strongly induced by CKD (note different y axis scale) and inhibited by BMP-7, CaCO3, or LaCO3. The number of aortas/mice in each group was four. Data are means of the transcript levels relative to GAPDH expression in each aorta ± SEM.

