Figure 2.
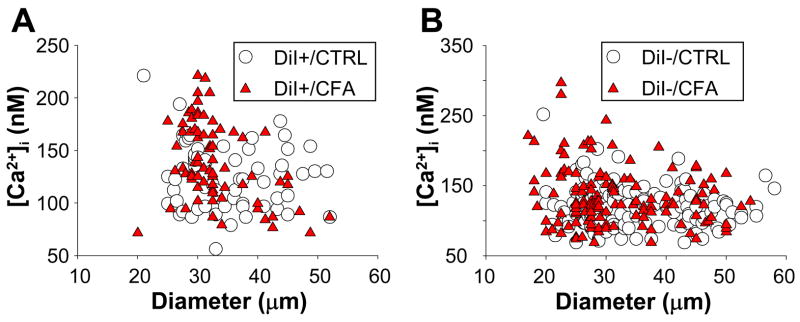
Scatter plots of resting [Ca2+]i versus cell body diameter for DiI+ (A) and DiI− (B) neurons from naïve (CTRL) and inflamed (CFA) rats. Inflammation was associated with an increase in resting [Ca2+]i in a subpopulation of small and medium diameter DiI− neurons. Note, scale of Y-Axis in A and B differ.

