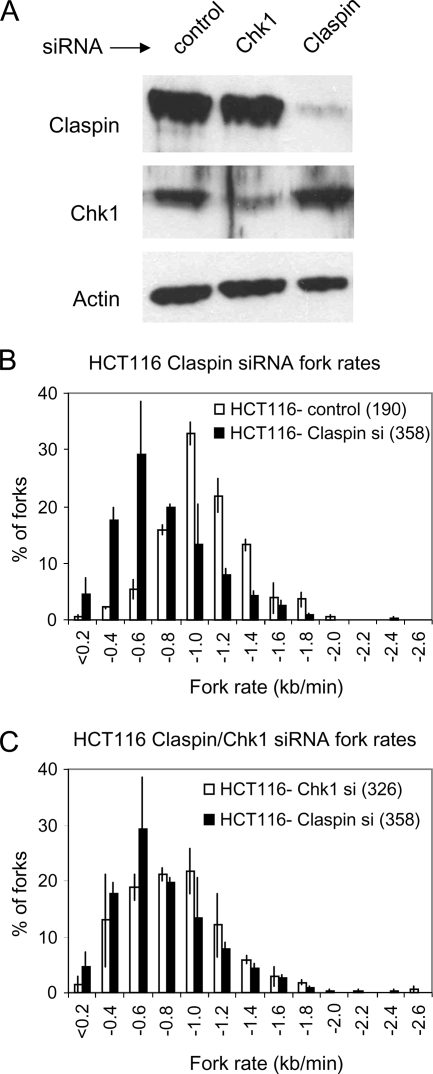
Figure 2.
Replication fork rates in HCT116 cells depleted of Claspin and Chk1. (A) Claspin, Chk1, and actin levels in total cell extract from HCT116 (p53+/+) cells mock treated or treated with Chk1 or Claspin siRNA for 24 h. (B) Distribution of replication fork rates in control- or Claspin-depleted HCT116 cells pulse labeled and processed as described above. (C) Distribution of replication fork rates in Chk1- or Claspin-depleted HCT116 cells. For each panel, the distribution of fork rates during the entire labeling period is shown. Data are combined from two independent experiments. In one experiment, mock transfection was used as a control, and in the other experiment, cells were treated with luciferase siRNA as control. For each data set, the similar results were observed in each experimental repeat. The total number of forks scored for each cell line is indicated in parentheses.

