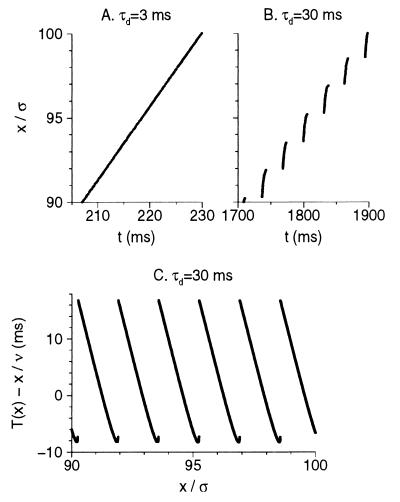
Figure 2.
(A and B) Rastergrams obtained from simulating Eqs. 2, 3, and 5 with the condition that each neuron can fire only one spike. Parameters: τ0 = 30 ms, τ2 = 2 ms, gsynVT = 10, c → ∞, N = 5 × 10⁴, ρ = 500; for these parameters, τdc = 11.15 ms. The solid circles represent the firing time of neurons as a function of their normalized position x/σ; spikes of only one out of every 50 neuron are plotted. Together, the groups of solid circles looks almost like one continuous line. (A) For τd < τdc (3 ms), a continuous pulse is obtained. (B) For τd > τdc (30 ms), the pulse is lurching. (C) The fluctuation around the constant-velocity solutions, T(x) − x/ν are plotted as a function of position x/σ for the same parameters as in B, to demonstrate the oscillatory nature of the lurching pulse. The firing times of all the neurons are plotted here as solid dots.

