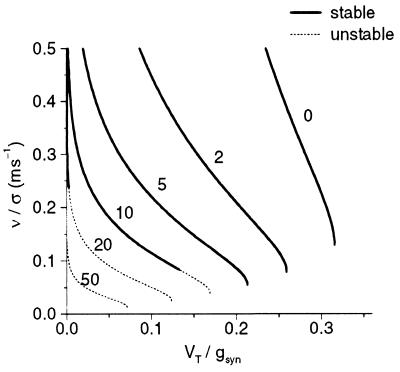
Figure 3.
The velocity of the continuous pulse as a function of VT/gsyn for several values of τd and exponential footprint shape (Eq. 14). The wide lines represent stable pulses and the narrow lines represent unstable pulses. The number above each line, from 0 to 50, denotes the value of τd. Parameters: τ0 = 30 ms, τ2 = 2 ms.

