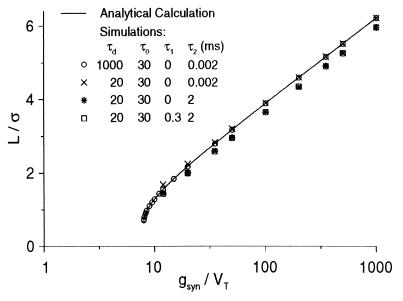
Figure 5.
The normalized length of the lurching period L/σ as a function of gsyn/VT. The analytical solution for the case τ1 = 0, τ2 ≪ τ0 ≪ τd (Eq. 18) is represented by the solid line. Simulations were carried out with N = 200,000 and ρ = 500. Simulations results with the corresponding parameter set: τd = 1000 ms, τ0 = 30 ms, τ1 = 0, τ2 = 0.002 ms, denoted by ○, fit the analytical solutions almost exactly. The symbol × denotes simulations with τd = 20 ms, τ0 = 30 ms, τ1 = 0, τ2 = 0.002 ms; the symbol ∗ denotes simulations with τd = 20 ms, τ0 = 30 ms, τ1 = 0, τ2 = 2 ms; and the symbol □ denotes simulations with τd = 20 ms, τ0 = 30 ms, τ1 = 0.3, τ2 = 2 ms.

