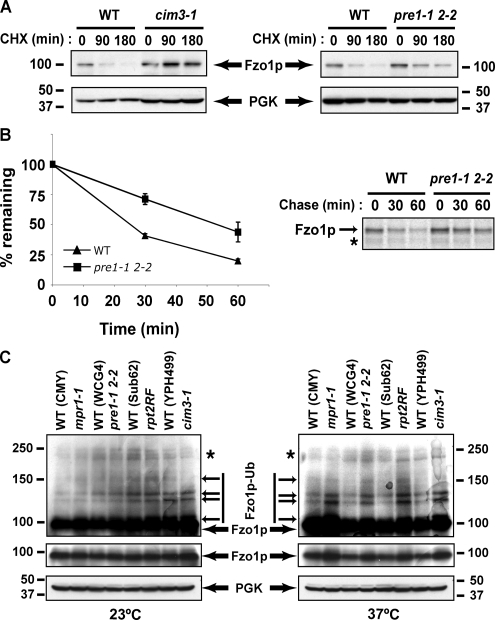
Figure 5.
Fzo1p is degraded by the 26S proteasome. (A) Fzo1p degradation was assessed in pre1-1 pre2-2 and cim3-1 proteasome thermosensitive strains and their corresponding isogenic wild-type strains (see Supplemental Data, Table S1) by treating with CHX. Yeast extracts were prepared at the indicated times and remaining Fzo1p evaluated by immunoblotting. (B) Fzo1-HA turnover was analyzed by 35S pulse-chase metabolic labeling in wild-type and pre1-1 pre2-2 strains. Graph on the left represents quantification of three experiments. A representative experiment is shown on the right. (C) Fzo1p levels were analyzed in four proteasome mutant strains and their isogenic wild-type controls grown at the permissive temperature (23°C) or after a 3-h shift to the restrictive temperature (37°C). Long (top panels) and short (middle panels) exposures of identical anti-Fzo1p blots are displayed. Note relative increase in levels in mutant strains at the restrictive temperature. PGK is utilized as a loading control.

