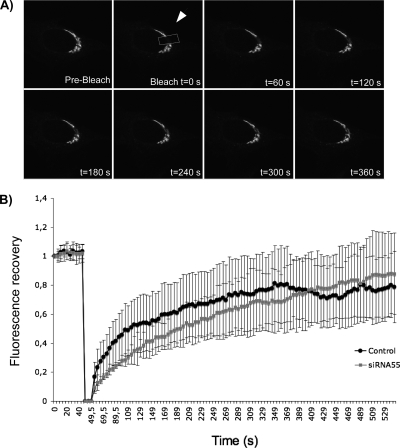
Figure 3.
Lateral mobility of Golgi enzymes in GRASP55 depleted cells. HeLa cells expressing ManII-GFP were treated with control (A) or GR55 siRNA (data not shown). After 72 h, the area of the Golgi indicated by the arrow was bleached. Recovery of fluorescence was followed for 500 s. Representative images of the indicated times are shown. (B) The ratio of fluorescence of the bleached area to the unbleached area of the Golgi was calculated and normalized. The rate of recovery in control siRNA-treated cells (black circles) and GR55-treated cells (gray squares) was plotted.

