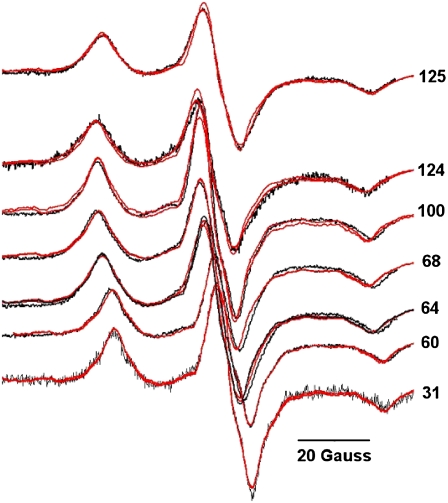
FIGURE 5.
ESR spectra of MTS-SL site-specifically spin-labeled subunit b acquired at 223 K. A subset of ESR spectra in frozen solution of specifically spin-labeled subunits b is shown in black. The acquired spectra are overlaid by the spectra simulated according to Hustedt et al. (67) to obtain interspin distances (shown in red). The spin-labeled amino acid positions are given in the figure. χ2 values of the fits were between 9.8 × 10² and 8 × 10³ for all fits.

