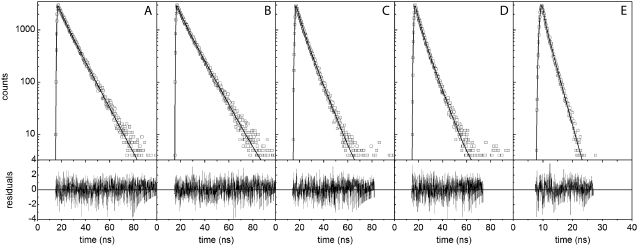
FIGURE 4.
Time-resolved fluorescence of the different probes bound to fibrillar AS. Fluorescence decay profiles of (A) 2,6-ANS, (B) 2,6-TNS, (C) bis-ANS, (D) bis-TNS, and (E) ThioT bound to AS fibrils. The lines represent the best fits obtained according to Materials and Methods, and the estimated parameters are given in Table 1. The weighted residuals are shown in the lower panels. Dye, 10 μM; protein, 100 μM.

