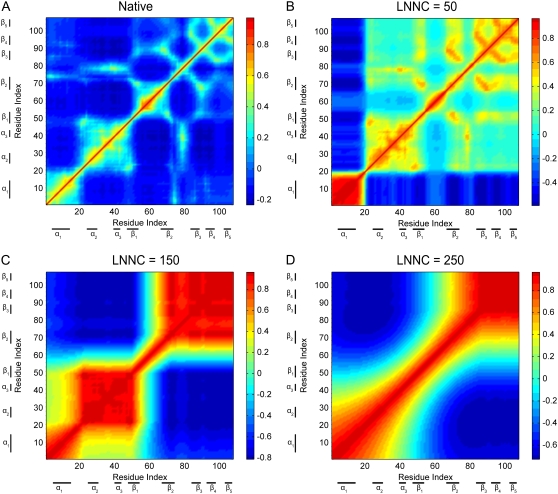
FIGURE 8.
The cross-correlation maps calculated with all modes for native conformation (A) and several conformations with LNNC to be 50 (B), 150 (C), and 250 (D) during the unfolding of barnase. The blue regions in the figure indicate negative correlation and the green-yellow-red regions represent positive correlation, as shown in the color bar on the right. Both the x and y axes of the maps are residue indices.

