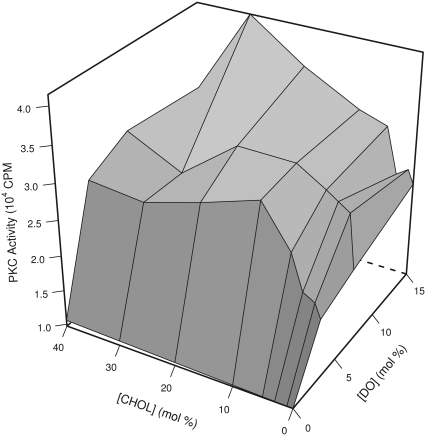
FIGURE 1.
Amplification by cholesterol of the activation of PK-C by diacylglycerol. PK-C activity of samples containing various concentrations of cholesterol (CHOL) and diolein (DO), with diolein concentration increasing from the center front to the right rear, and cholesterol concentration increasing from the center front to the left rear. Every intersection is the mean of PK-C activity from triplicate samples from a single experiment, with error bars corresponding to standard error omitted for clarity. See Fig. 2 for representative error sizes. The shading indicates the average activity of each quadrilateral: lighter shading indicates higher activity.

