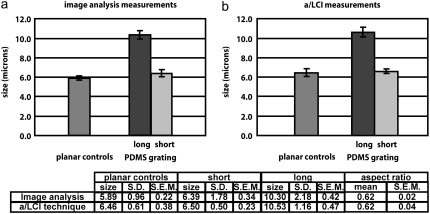
FIGURE 8.
Results of measurements of murine macrophage cell nuclei using (a) image analysis and (b) a/LCI technique. The planar controls were determined by image analysis to be nonoriented spheroids with a small aspect ratio; it is reported as the average between the major and minor axes. For the a/LCI measurements, there was a bimodal distribution of sizes. One size was within the 95% confidence interval of the planar controls, and the other size distribution contained sizes at least four standard deviations larger than the planar controls. The short size was determined to correspond to the minor (equatorial) axis of the macrophage cell nuclei; the large size was determined to correspond to the major (polar) axis of the macrophage cell nuclei. Results of measurements using image analysis and a/LCI analysis are reported in the table. Nuclear elongation is statistically significant (p < 0.01) for both a/LCI and image analysis measurements.

