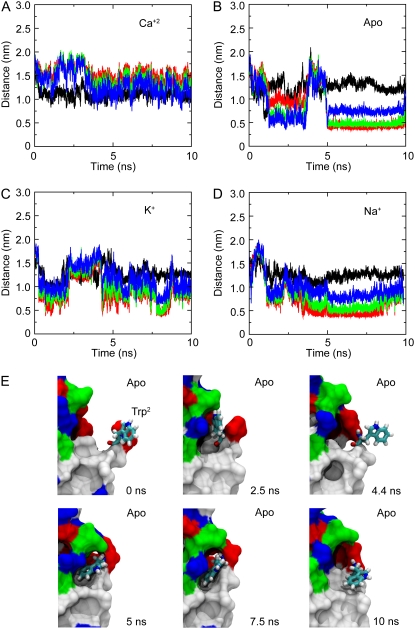
FIGURE 6.
Dynamics of Trp2. The state of Trp2 is characterized by the distance to its neighboring residues during simulations with (A) and without (B) Ca2+, as well as with K+ (C) and Na+ (D) ions replacing Ca2+. Distances between the Cα atom of Trp2 and Cα atoms of residues Ile24, Lys25, and Ser26 are shown in red, green, and blue, respectively. The distance between atom Nɛ of Trp2 and the carbonyl oxygen atom of Glu90 is shown in black. Intermittent bound states can be clearly observed during simulations performed without Ca2+. (E) Snapshots show Trp2 in licorice representation at times t = 0, 2.5, 4.4, 5, 7.5, and 10 ns during SimApo1. The rest of the EC1 domain is shown in surface representation and colored according to hydrophobicity (white, hydrophobic residues; green, polar residues; red or blue, charged residues).

