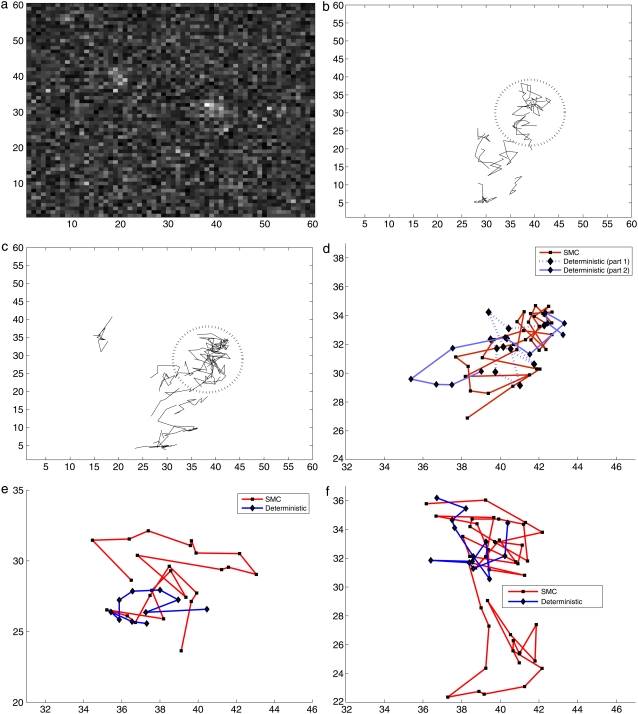
FIGURE 10.
Comparison with a second set of experimental data: (a) 78th frame from the experimental data. (b and c) Full trajectories found by a deterministic method and by SMC, respectively; and panels d–f compare the tracks by a deterministic method and SMC for the same period of time in the dotted and circled region in panels b and c.

