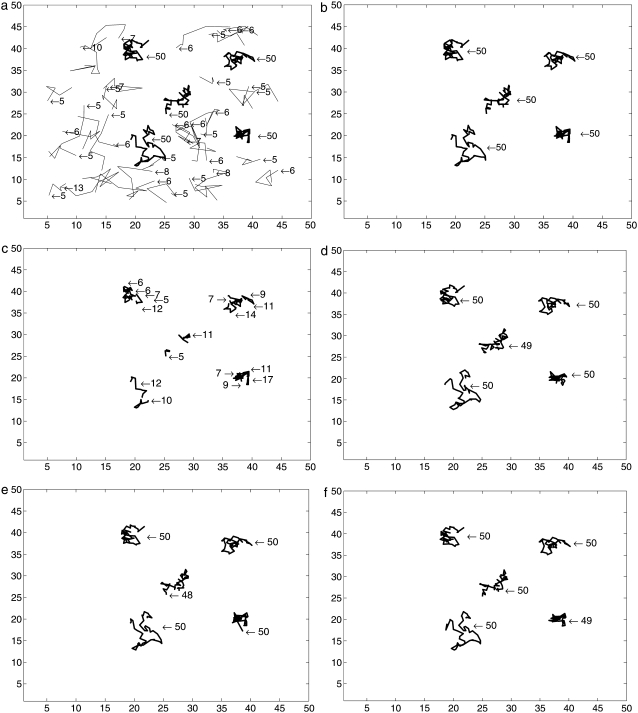
FIGURE 2.
Comparison of trajectories detected by a deterministic method with variable thresholds and by SMC method with different sample size: (a) by a deterministic method with a low threshold 22; (b) by a deterministic approach with a proper threshold 50; (c) by a deterministic approach with a high threshold 90; (d) by SMC method with 100 samples used in the Monte Carlo scheme; (e) by SMC method with 1000 samples used; and (f) by SMC method with 2000 samples used.

