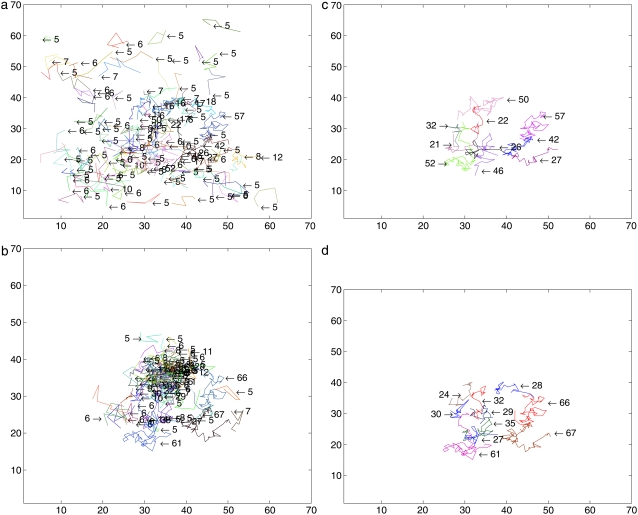
FIGURE 9.
Comparison with experimental data: (a) trajectories longer than five steps detected by the deterministic method; (b) trajectories longer than five steps detected by the SMC method; (c) trajectories longer than 20 steps detected by the deterministic method; and (d) trajectories longer than 20 detected by SMC method.

