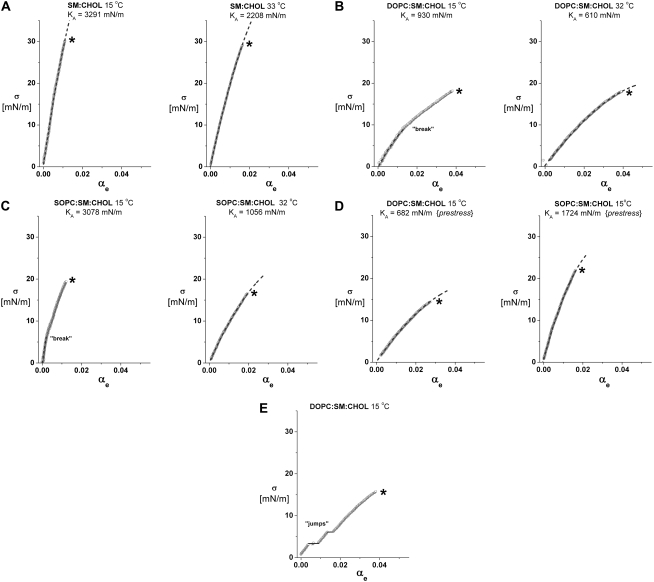
FIGURE 1.
Representative examples of vesicle bilayer tension σ versus dilation in lipid-surface area αe measured by micropipette pressurization at 15°C and at 32–33°C. (To emphasize the data, the ∼1000 points measured during each test are plotted as small gray circles. The dotted black curves superposed on the data are fits of a cubic polynomial used to accurately determine the slope at zero tension (e.g., the elastic modulus KA) as discussed in the text. (A) Sample tests of 1:1 SM/CHOL vesicles show the smooth-continuous stretch response seen at both 15°C (left panel) and 33°C (right panel). (B) Tests of 1:1:1 DOPC/SM/CHOL vesicles loaded continuously without prestress (see text) show a break in slope near 10 mN/m observed routinely at 15°C (left panel) and the smooth-continuous stretch response observed at 32°C (right panel). (C) As for the DOPC/SM/CHOL system, tests of 1:1:1 SOPC/SM/CHOL vesicles loaded continuously without prestress show a break in slope near 5 mN/m observed routinely at 15°C (left panel) and a smooth-continuous stretch response at 32°C (right panel). (D) On the other hand, tests of 1:1:1 DOPC/SM/CHOL vesicles (left panel) and 1:1:1 SOPC/SM/CHOL (right panel) vesicles show the smooth-continuous stretch response observed routinely at 15°C when subjected to prestress followed by continuous loading. (E) Only rarely seen (<10% of cases), this test of a 1:1:1 DOPC/SM/CHOL vesicle at 15°C shows discrete jumps in area presumably due to incorporation of fluid membrane blebs.

