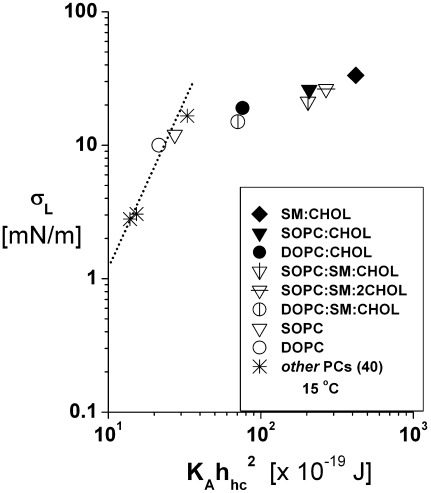
FIGURE 5.
Lysis tensions σL measured at 15°C are plotted as functions of the bending elasticity parameter  computed with the elastic-stretch moduli from Fig. 2 (Table 1) and values of hydrocarbon thickness in Table 2. Also included are data obtained previously for thin (diC13:0, diC18:2) and thick (diC22:1) PC bilayers (40). The dotted line connecting the data for the fluid PC bilayers indicates the correlation to bending elasticity expected for hydrophilic pores lined with rounded edges.

