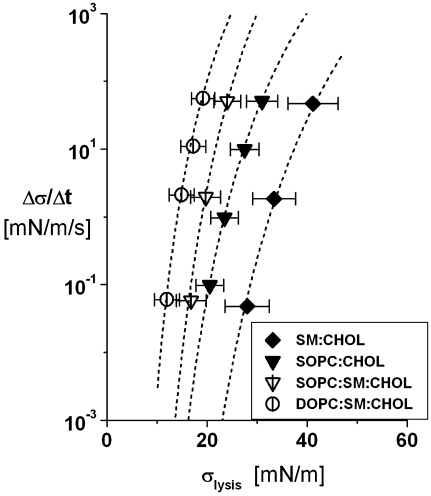
FIGURE 8.
Stress-rate dependences of the lysis tensions measured at 15°C for the ternary 1:1:1 PC/SM/CHOL plus binary 1:1 SM/CHOL and 1:1 PC/CHOL vesicles. Here, the standard deviations in rupture tensions are added to show the inherent widths in distributions of rupture events that arise from the kinetics of membrane failure. As noted in the legend of Fig. 3, very small standard errors in measurements represent the relevant statistical variations that characterize the most frequent rupture events. (Even though similar in form, the results for 1:1 DOPC/CHOL and 1:1:2 SOPC/SM/ CHOL vesicles were left out of the figure for clarity.) The continuous dotted curves are fits of the kinetic rupture model described in the Appendix to the most frequent rupture tensions yielding the thermal tension scales σβ correlated with the single stress-rate measurements of lysis tension plotted in Fig. 3 B.

