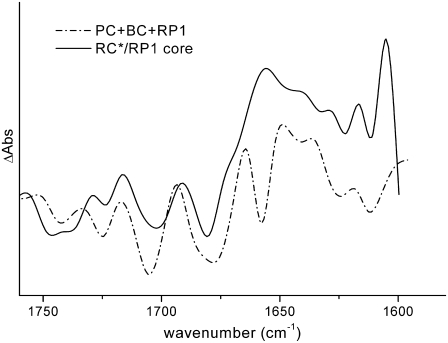
FIGURE 8.
Comparison between the RC*/RP1 spectrum obtained by target analysis on PS2 core complex samples (solid line) with the sum of the excited-state spectra (PC and BC) and first radical pair spectra obtained for isolated reaction centers from spinach (dash-dotted line). The PC and BC spectra have been obtained from a target analysis of time-resolved data measured for isolated RCs. In the target model, two excited-state compartments were introduced, one from which charge separation can readily occur (PC), and the other of which transfers on a slow timescale to the first (BC) (for discussion, see Groot et al. (8)).

