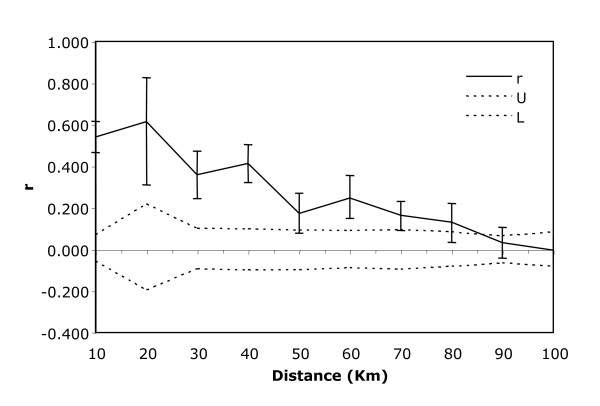
Figure 3.
Correlogram showing the results of the fine-scale spatial autocorrelation analysis where genetic correlation values (r) are plotted as a function of distance. U and L represent 95% confidence intervals around the null hypotheses of no structure. The plot shows that there is a significant positive genetic structure at all distances classes less than 90 km distance class.

