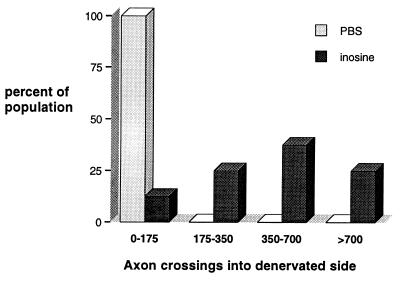
Figure 4.
Axon crossings: frequency distributions for inosine- and PBS-treated groups. For each animal, we determined the mean number of crossed axons in the three coronal sections that showed the highest density of reinnervation. The x axis of the histogram shows the mean number of crossed axons, whereas the y axis represents the percentage of animals with axon numbers in each range. The distributions for numbers of crossed fibers show little overlap between the inosine-treated (n = 8; darkly shaded bars) and PBS-treated (n = 6; lightly shaded) groups.

