Figure 4.
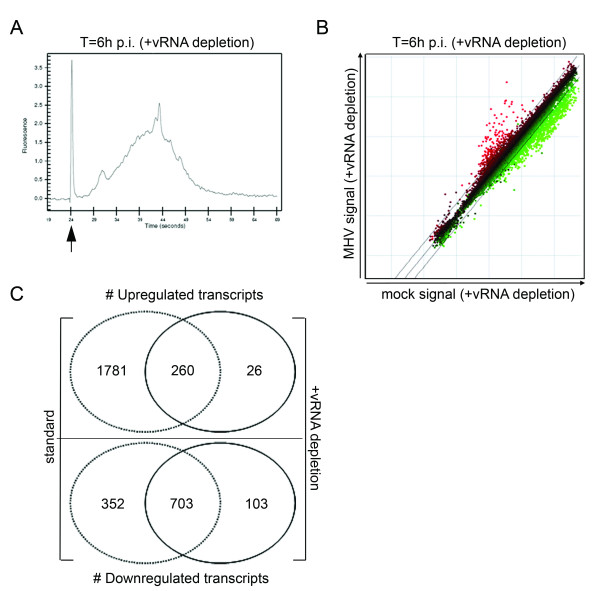
vRNA depletion improves microarray analysis. Total RNA samples were obtained from mock- and MHV-infected LR7 cells at 6 h p.i. were subjected to the vRNA depletion protocol as detailed in the Materials and methods section. (A) Amplification of the mRNA was monitored by analyzing the cRNA samples with a Bioanalyzer. A representative mRNA amplification plot of a total RNA sample derived from MHV-infected cells at 6 h p.i. after vRNA removal is shown. The arrow indicates the marker peak. (B) Total RNA samples were treated with the biotinylated oligo's (indicated as vRNA depleted) and were processed for microarray analysis as described in the Methods section. The scatter plots display the average expression values from independent dye-swap hybridizations (n = 6) for each gene present on the arrays as described in legend of Fig.2. (C) The Venn diagrams show a comparison between the experiments with and without vRNA depletion.

