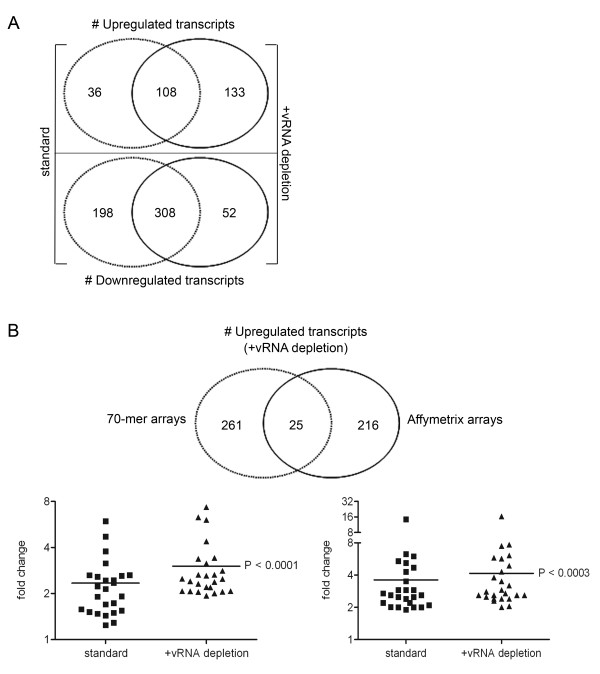
Figure 5.
vRNA depletion increases sensitivity on different microarray platforms. (A) Affymetrix arrays were hybridized independently with the same target samples (t = 6 h p.i.; treated with or without vRNA depletion) as described for the 70-mer oligonucleotide arrays. Data analysis was performed as described in the Methods section. The Venn diagram depicts the comparison of the number of upregulated and, separately, the downregulated genes in the two experimental settings (with and without (standard) vRNA depletion). (B) The Venn diagram shows a comparison of the upregulated transcripts obtained with both the 70-mer arrays and the Affymetrix arrays using the vRNA depletion method. The genes within the intersection (n = 25) were selected and the fold changes in gene expression, as discovered by each array analysis, for both methods (standard versus vRNA depleted) are plotted in the graph. Note that the induced expression of several of these genes was validated by quantitative RT-PCR (see Additional file 1). A paired t-test was performed to show the significant difference between both methods for each platform.

