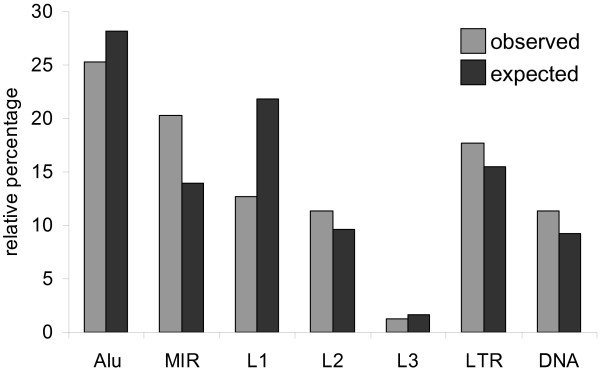
Figure 1.
Observed versus expected frequencies of TE-derived TFBS. The observed percentages (light) of TE-derived TFBS from different classes/families of human TEs are plotted along with the percentages that are expected (dark) based on the background frequencies of the TEs in the genome. All class/family percentages are relative, i.e. they are normalized by the total number of TEs that donate TFBS (observed) and the total number of TEs in the genome (expected) respectively.

