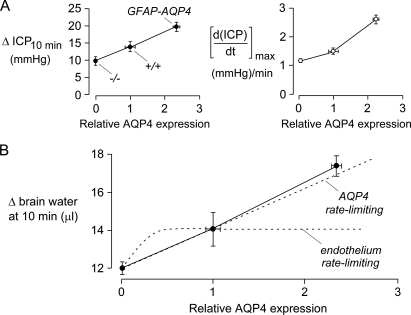
FIGURE 4.
Correlations between ICP parameters and brain AQP4 protein expression. A, ΔICP at 10 min (left) and maximal d(ICP)/dt (right) determined from ICP curve analysis plotted against AQP4 protein expression determined by immunoblot analysis (S.E.). B, deduced increase in brain water at 10 min following intraperitoneal administration of water (Δ brain water, in μl), as a function of brain AQP4 expression. Δ brain water at 10 min is a measure of osmotic water permeability of the blood-brain barrier. Hypothetical curves (dashed) show predictions if AQP4 is rate-limiting for blood-brain barrier water permeability versus if the endothelium is rate-limiting for blood-brain water permeability.

