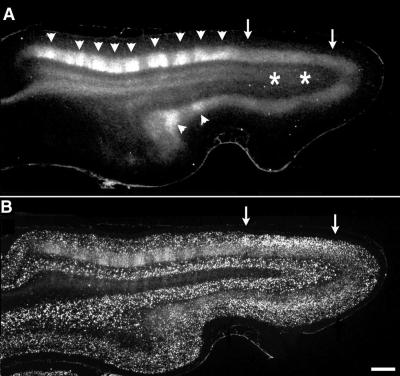
Figure 2.
Correlation of area of disrupted ocular dominance columns with region of BDNF mRNA up-regulation. (A) Horizontal section through primary visual cortex in a P56 animal after kainic acid injections into visual subplate at P8 and a monocular injection of 3H-proline at P46. The patchy appearance of label in layer 4 (arrowheads) anterior to the kainic acid injection sites (asterisks in white matter) indicates the presence of normal ocular dominance columns. However, the uniform band of label in layer 4 (region between arrows) overlying the injection sites indicates that ocular dominance columns have failed to form there. (B) Section adjacent to A, double labeled for transneuronally transported radioactive label, and in situ hybridization for BDNF mRNA. The region lacking ocular dominance columns corresponds to the region in which BDNF mRNA levels are persistently increased even at this older age (arrows). Anterior Left, medial Upper. Bar = 1 mm.

