
Figure 4.
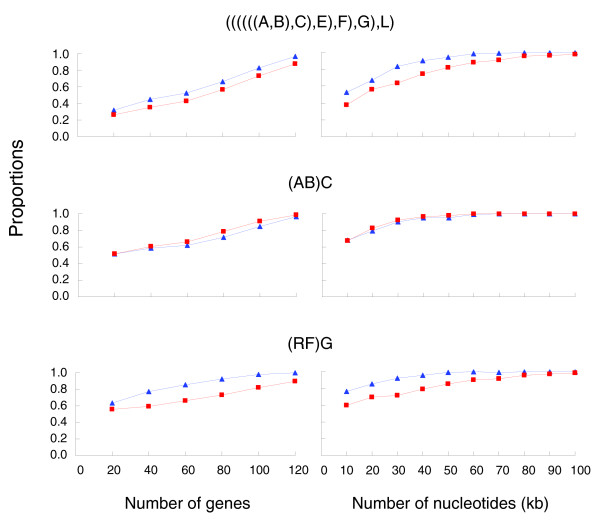
The proportions of topologies (or clades) that are identical to those shown in Figure 1 based on resampling of 142 gene sequences at various scales. Results of ML and MP analyses are indicated by blue and red, respectively. Genome types are represented with the same capital letters as in Figure 3.