
Figure 3.
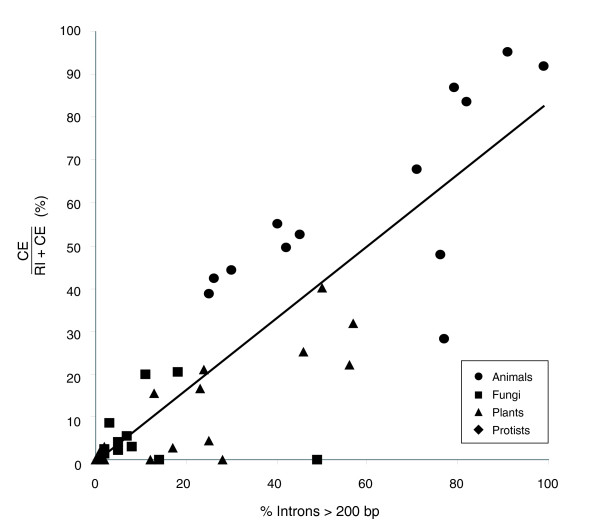
Relationship between long introns and CE fraction. The percentage of long introns (greater than 200 bp) is correlated with the CE fraction (). The best-fit line is y = 0.84x + 0.00 (R2 = 0.73). In each of four major eukaryotic groups (animals, fungi, plants and protists), species with more long introns display a higher propensity toward CEs.