
Figure 6.
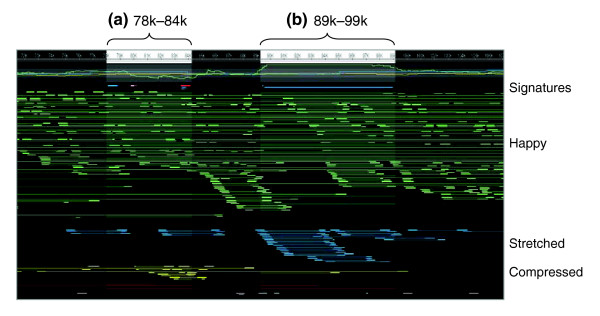
Hawkeye screen shot of an example D. virilis mis-assembly. Sequencing reads are represented as thick boxes connected to their mate by thin lines. Correctly sized (happy) mates are shown in green, stretched in blue, and compressed in yellow. A CE statistic plot is given at the top, with mis-assembly signatures plotted directly below as intervals. (a) The amosvalidate region, which appears to be a compression mis-assembly. (b) The amosvalidate region, which appears to be an expansion mis-assembly.