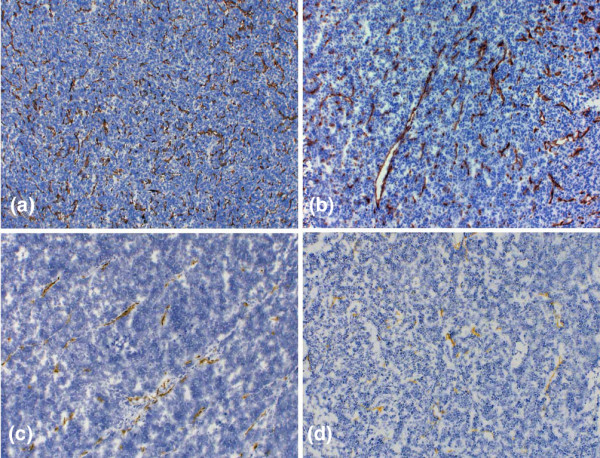
Figure 5.

Immunhistochemistry of tumour xenografts. (a-d) Brown precipitates indicate the presence of CD31, representing microvessel formation: panel a shows MDA-MB435 tissue, panel b HT1080, panel c MCF7, and panel d DU4475. Note the strong difference in tumour vascularization. Although the MDA-MB435 and the HT1080 tumours exhibit a high degree of angiogenesis, the DU4475 and MCF7 tumours show a clearly lower amount of CD31 positive vessels (original magnification: 100×). Analysis of blood vessel profile density (BVPD) per area for all tumour types using stereological tools revealed the highest BVPD to be in MDA-MB435 (399 ± 36 BVPs/mm2) tumours followed by the HT1080 tumours (128 ± 38 BVPs/mm2), whereas the other two tumour types exhibited lower BVPD at a comparable level (MCF7 59 ± 10 BVPs/mm2; DU4475 78 ± 16 BVPs/mm2).
