
Figure 3.
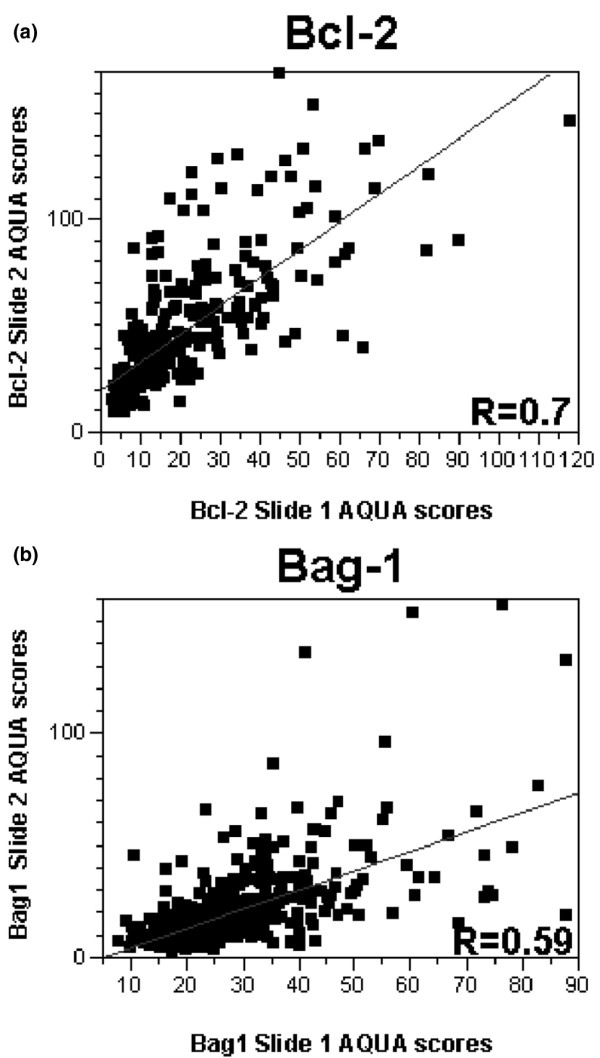
Regression plot for scores from breast cancer arrays stained for Bcl-2 and Bcl-2 antanogene-1. Regression plot for scores from the two breast cancer arrays stained for (a) Bcl-2 and (b) Bcl-2 antanogene-1 (Bag-1). AQUA, automated quantitative analysis.