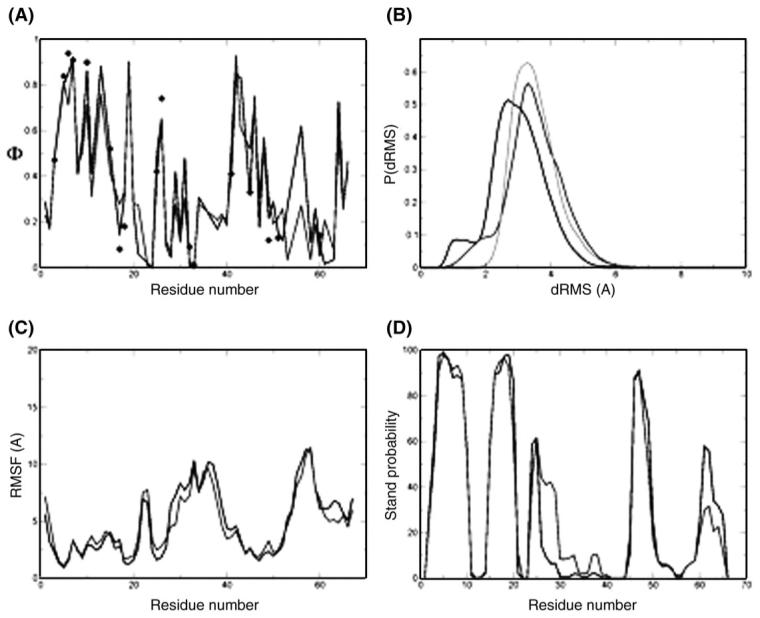
Fig. 2.

TS ensemble of CspB. (A) Φ-value profiles of the ‘specific simulations’ TSE (black curve) and the ‘classes simulations’ TSE (light gray curve); the experimental Φ-values are indicated by black diamonds. (B) Histogram of dRMS between all pairs of structures within each TSE and between the TSEs. The black line is the distribution of dRMS within the ‘specific simulations’ TSE and the light gray line the distribution of dRMS within the ‘classes simulations’ TSE. The dark gray line is the distribution of dRMS between the TSEs. (C) RMSD fluctuations per residue for the ‘specific simulations’ TSE (black curve) and the ‘classes simulations’ TSE (light gray curve). (D) Probability of β strand formation in the TSEs of CspB computed using the program DSSPcont (Carter et al., 2003). The ‘specific simulations’ TSE is represented by the black line and the ‘classes simulations’ TSE by the light gray line. The two methods generated structures of very similar secondary structure.
