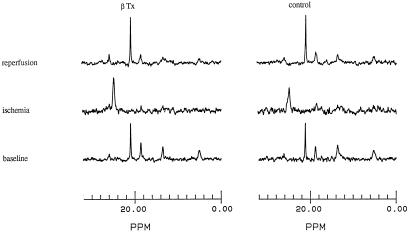
Figure 3.
Representative 31P NMR spectra for a β-Tx (Left) and a control (Right) heart at baseline (Bottom), at the end of 12-min ischemia (Middle), and at the end of 24-min reperfusion (Top). For each spectrum, from left to right, the peaks represent Pi, PCr, and γ-, α-, and β-phosphates of ATP. The difference in the chemical shift of Pi and PCr is proportional to the pHi. Note the shift of Pi peak during ischemia, indicating intracellular acidosis.

